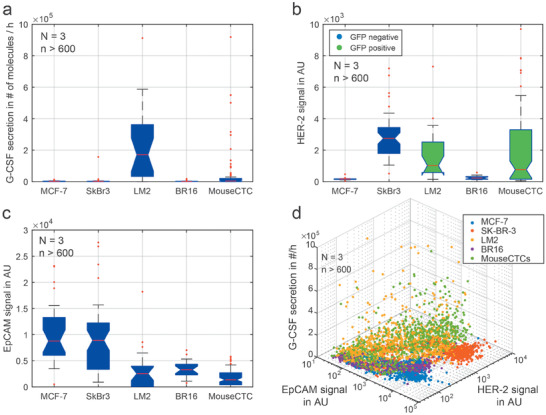
Figure 5.

Protein expression of single cells and mouse model CTCs. a) Quantitative analysis of the G‐CSF secretion levels after 4 h of incubation. b) Comparison of HER‐2 expression for the five tested cell lines. The LM2 cells and mouse model CTCs did express GFP, which obscures the HER‐2 expression. c) Comparison of EpCAM expression in all tested cell lines. d) 3D scatterplot correlating EpCAM and HER‐2 signals with the G‐CSF secretion. This enables the discrimination of the individual cell lines. N: Number of microdevices, n: total number of analyzed cells.
