Figure 1.

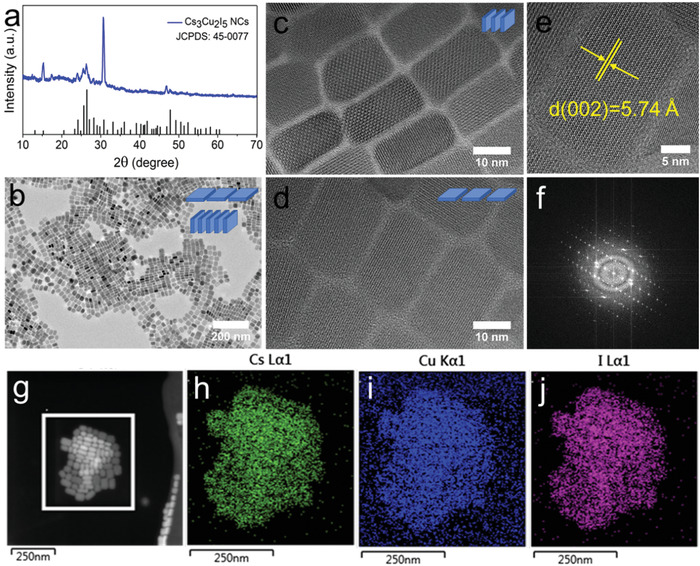
a) XRD pattern and b) TEM image of Cs3Cu2I5 NCs. HRTEM images with the Cs3Cu2I5 NCs c) in face‐to‐face stacking and d) lying flat. e) A typical HRTEM image of a single Cs3Cu2I5 NC with enlarged view, and f) its corresponding FFT pattern. g) HAADF‐STEM measurement of Cs3Cu2I5 NCs, and the corresponding EDS mapping of elemental h) Cs, i) Cu, and j) I distributions.
