Figure 3.

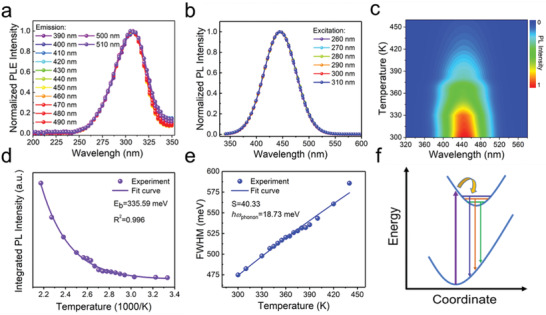
a) PLE spectra and b) PL spectra of Cs3Cu2I5 NCs measured at different emission and excitation wavelengths, respectively. c) Pseudocolor map of temperature‐dependent PL spectra of the Cs3Cu2I5 NCs. d) The correlation between integrated PL intensity and temperature derived from (c). By fitting the curve, the exciton binding energy was extracted. e) The fitting results of the FWHM as a function of temperature derived from (c). f) The coordinate diagram demonstrating the photophysical process in Cs3Cu2I5 NCs.
