
Figure 3.
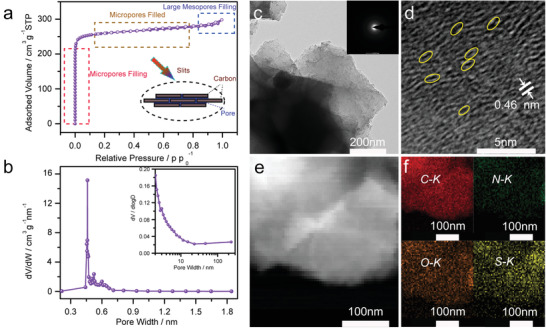
a,b) Nitrogen absorption/desorption isotherms and relative pore size distribution of ACC. c) TEM and d) HRTEM images of the ACC‐40S sample. Inset in (c) is the corresponding SEAD pattern. e,f) STEM image of the ACC‐40S sample and corresponding EDS mappings of C, N, O, and S elements.