
Figure 6.
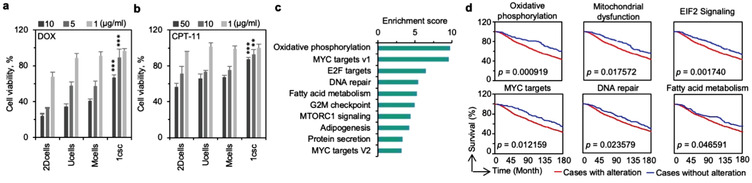
Implications for developing CSC‐targeted therapeutic strategies. a,b) Viability of the cells obtained by 2Dcells, Ucells, Mcells, and 1csc cultures of MDA‐MB‐231 cells after treating them with doxorubicin hydrochloride (DOX, (a)) and camptothecin‐11 (CPT‐11, (b)). For DOX, the p value for the 1csc group versus the 2Dcells, Ucells, and Mcells groups is <0.0001 for both 10 and 5 µg mL−1. For CPT‐11, the p value for the 1csc group versus the 2Dcells, Ucells, and Mcells groups is <0.0001 for 50 µg mL−1 and it is 0.0034 for 10 µg mL−1. Error bars denote mean ± s.d., and statistical significance was assessed by one‐way ANOVA with post hoc Tukey test. **p < 0.01, and ***p < 0.001. c) Gene set enrichment analysis (GSEA) of the signaling pathways enriched in 1csc colony cells compared with cells from the 2Dcells, Ucells, and Mcells cultures. d) Overall survival via Kaplan–Meier Estimate of patients with enriched core genes in oxidative phosphorylation, mitochondrial dysfunction, EIF2 signaling, MYC targets, DNA repair, and fatty acid metabolism pathways (red line). The blue line shows the survival of patients without enrichment in the respective pathways. Statistical significance was assessed by Kaplan–Meier survival analysis.