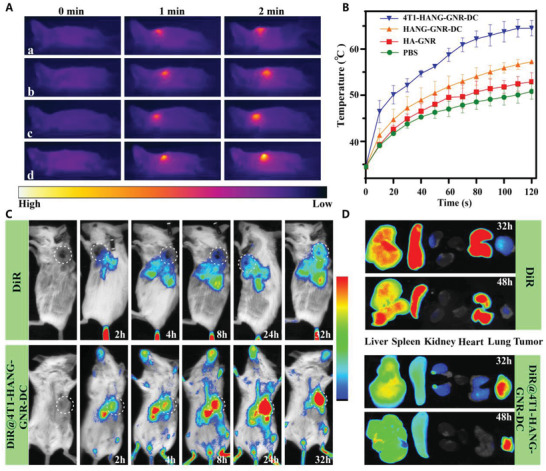
Figure 4.

A) Infrared thermography of tumor‐bearing mice injected with a: NS, b: HA‐GNR, c: HANG‐GNR‐DC, and d: 4T1‐HANG‐GNR‐DC under irradiation for 2 min (808 nm, 1.0 W cm−2). B) Temperature curve of the tumor from the mice during NIR irradiation. C) In vivo distribution of free DiR and DiR@4T1‐HANG‐GNR‐DC in tumor‐bearing mice at different time points. D) Ex vivo tissue distribution of sacrificed mice at 32 and 48 h after the injection.
