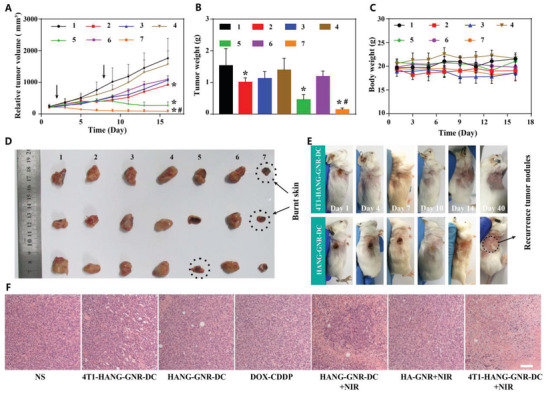
Figure 5.

A) Tumor volume of 4T1 tumor‐bearing mice treated with different preparations (1, NS; 2, 4T1‐HANG‐GNR‐DC; 3, HANG‐GNR‐DC; 4, DOX‐CDDP; 5, HANG‐GNR‐DC + NIR; 6, HA‐GNR + NIR; 7, 4T1‐HANG‐GNR‐DC + NIR) during 16 days treatment. B) Tumor weight and C) body weight of the mice from different groups. D) Collected tumors from each group. E) Observation of tumor recurrence of mice after 16 days anti‐tumor treatment. F) H&E staining of the tumor tissues after different treatments (scale bars = 20 µm). Mean ± SD (n = 4), *p < 0.05 (compared with the NS group), # p < 0.05 (compared with the HANG‐GNR‐DC + NIR group).
