
Figure 3. Beige-to-white fat transition upon CR withdrawal is due to decrease in mitochondrial biogenesis.
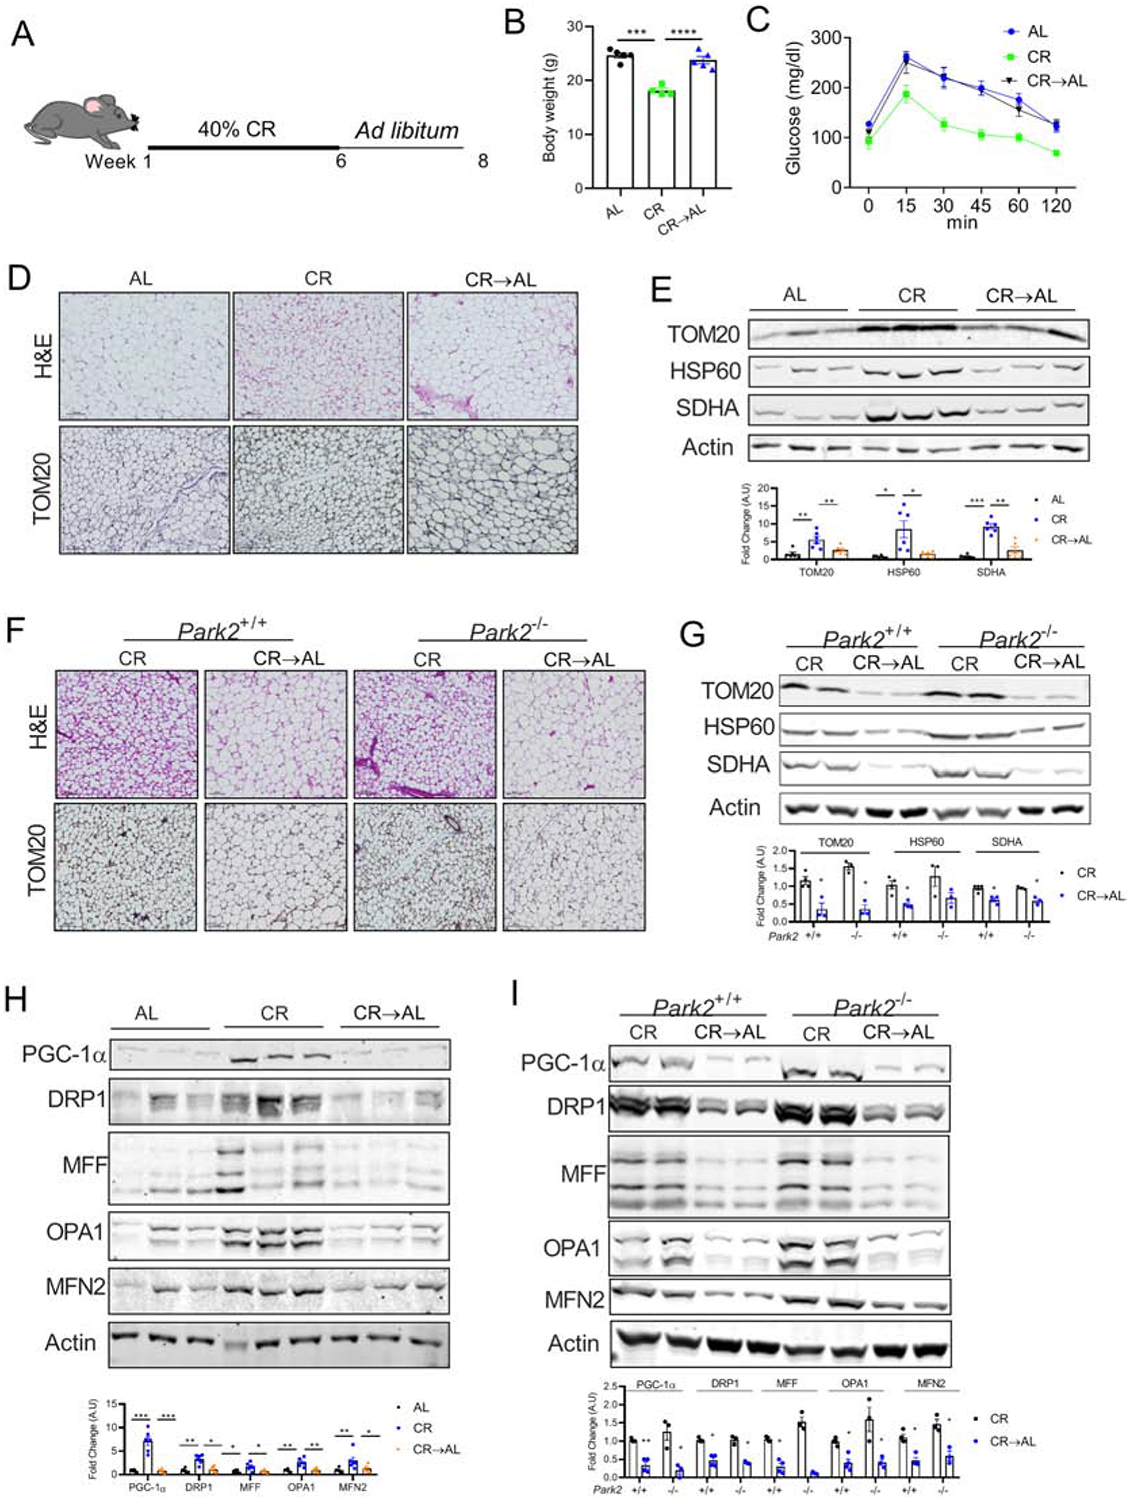
(A) Schematic representation of the experimental design. Six-weeks old C57BL6 mice were fed with 40% calorie restricted chow diet (CR) for 6 weeks following which one group of mice were switched back to ad libitum chow diet and all the mice continued on their respective diets for additional 2 weeks. (B) Body weight of the mice. (C) Intraperitoneal glucose tolerance test (ipGTT) performed in CR→AL mice (n=3–5 mice/group). (D) H&E staining (top panel) and immunohistochemistry for TOM20 (bottom panel) in the iWAT, magnification - 20X. (E) Immunoblots and densitometric analysis for mitochondrial proteins in the iWAT. (F) H&E staining (top panel) and immunohistochemistry (bottom panel) performed on the iWAT of global females parkin2 KO (Park2−/−) and their littermates (Park2+/+) controls, magnification - 20X (n= 3–4 mice/group). (G) Immunoblots and densitometric analysis of the mitochondrial proteins in the iWAT of female Park2−/−mice. (H) Immunoblots and densitometric analysis of the mitochondrial biogenesis and dynamics-related proteins in the iWAT. (I) Immunoblots and densitometric analysis of the mitochondrial biogenesis and dynamics-related proteins in the iWAT of Park2−/−mice.