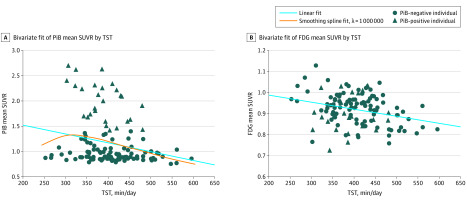
Figure. Association of Total Sleep Time (TST) With Positron Emission Tomography Imaging.
A, TST was inversely associated with mean carbon-11 labeled Pittsburgh compound B (PiB) uptake in the change-point regression model after adjusting for covariates. The inclination of the graph started to reverse because of the boundary of the specified threshold (ie, 325 minutes) for TST. TST was inversely associated with PiB uptake in sleep durations longer than 325 min. B, TST was inversely associated with mean fluorine-18 fluorodeoxyglucose (FDG) uptake in the multiple regression model after adjusting for covariates and the false-discovery rate correction. SUVR indicates standardized uptake value ratio.

