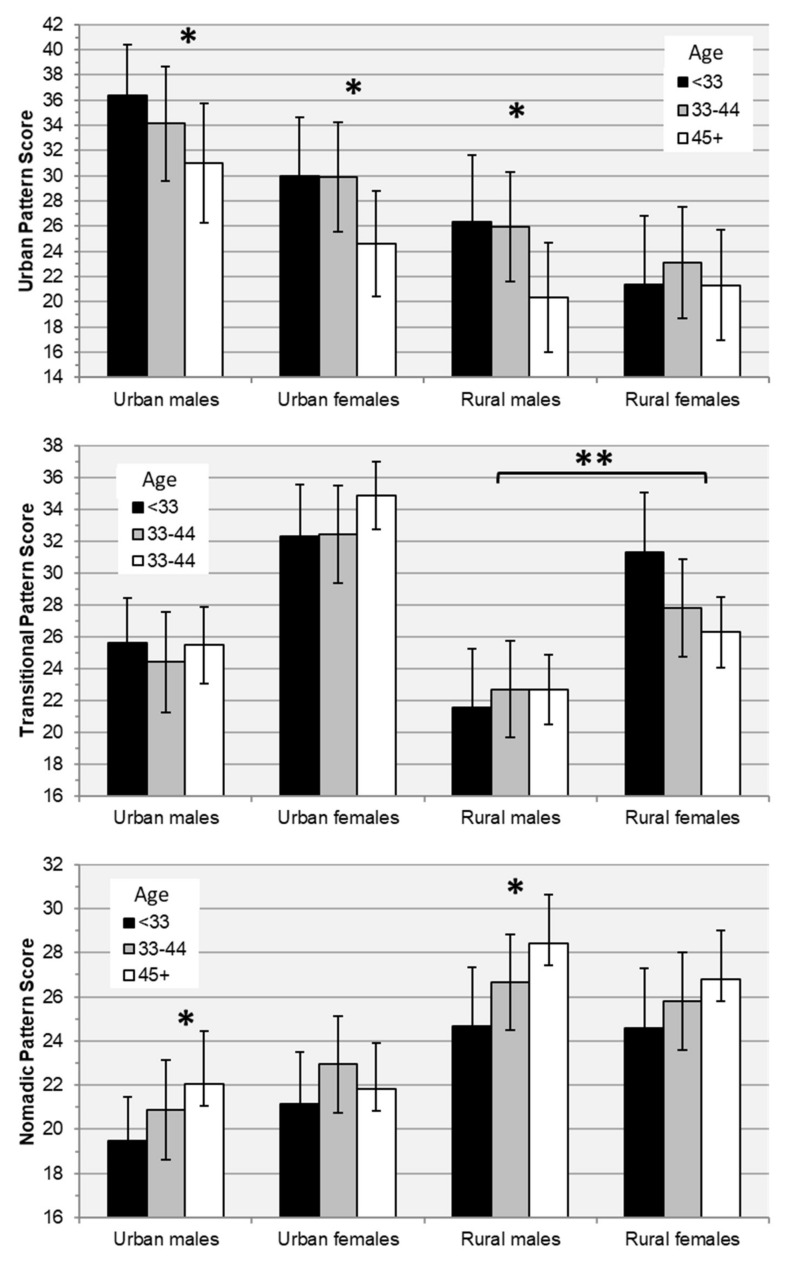
Figure 3.
Age-trends in estimated marginal means of diet pattern scores by subgroup. Means are estimated using a regression model in which summer or winter pattern score (n = 635) is predicted using an age group × urbanicity-sex group interaction term adjusted for province, season, within-season mean daily energy intake, and a random intercept per person to account for within-person correlation across seasons. Error bars indicate 95% confidence intervals. * Significant linear trend with age (p < 0.05). ** Significant difference in age trends between rural males and females.

