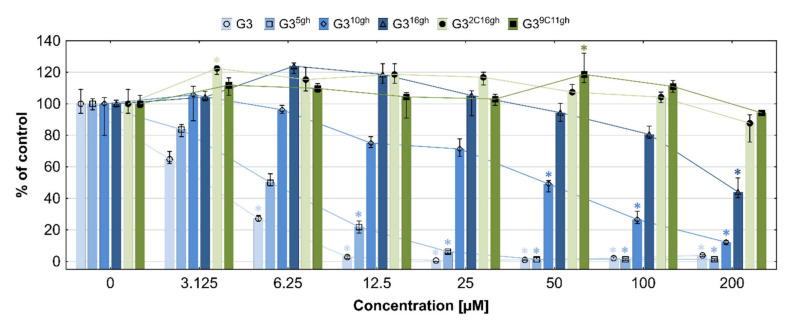
Figure 10.
The cytotoxic effect of studied compounds on BJ cells after 24 h incubation, estimated with neutral red assay: Results present as medians of the percent of control taken as 100%. Whiskers mean upper (third) and lower (first) quartile ranges. Statistically significant differences in relation to non-treated control are marked with *, p < 0.05.

