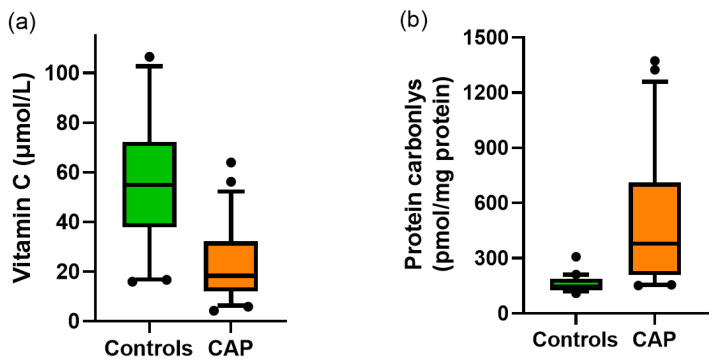
Figure 1.
Vitamin C status and protein carbonyl concentrations in the community-acquired pneumonia (CAP) cohort and healthy controls. (a) Vitamin C was measured using HPLC with electrochemical detection, p < 0.001, n = 50 for both controls and CAP. (b) Protein carbonyls were measured using ELISA; p < 0.001, n = 50 for controls, n = 46 for CAP. Box plots show median with 25th and 75th percentiles as boundaries, and whiskers are the 5th and 95th percentiles, with symbols indicating outlying data points.

