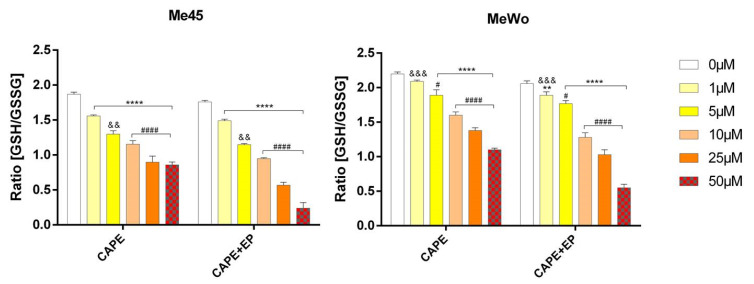
Figure 3.
The level of the ratio of reduced to oxidized glutathione (GSH/GSSG) in Me45 and MeWo cell lines after 24-h incubation following increasing concentrations of CAPE or CAPE connected with EP. Error bars shown are means ± SD for n = 6. For Dunnett’s multiple comparisons tests: ** statistically significant for p = 0.0016, **** statistically significant for p < 0.0001. For Sidak’s multiple comparisons tests: && statistically significant for p = 0.0032, &&& statistically significant for p = 0.0003, # statistically significant for p = 0.043, #### statistically significant for p < 0.0001.

