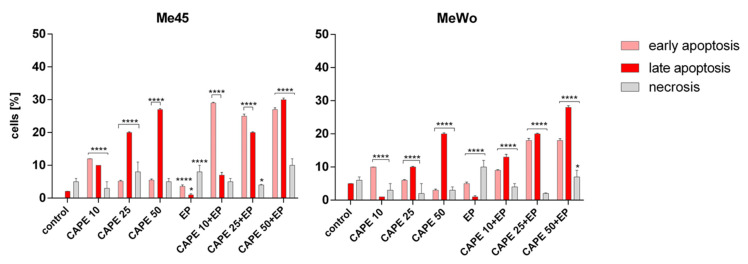
Figure 6.
The evaluation of the type of induced cell death by flow cytometry in Me45 and MeWo cells after 6-h incubation with increasing concentrations of CAPE and CAPE combined with EP. Control cells were incubated in cell cultured medium. Error bars shown are means ± SD for n = 3; * statistically significant for p = 0.0263, **** statistically significant for p < 0.0001.

