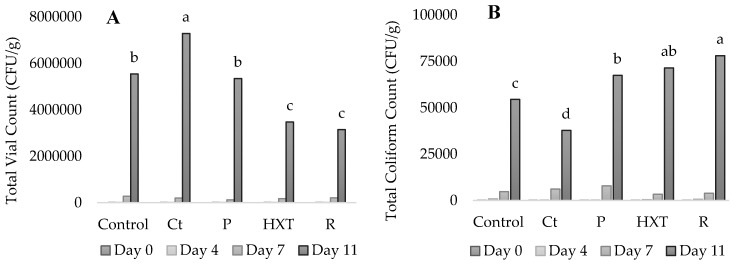
Figure 3.
Evolution of microbiological growth during shelf-life study of fish patties. Total vial count (TVC; A). Total coliform count (TCC; B). Control (C); 200 ppm acerola + 200 ppm citric extract (Ct); 200 ppm acerola + 200 ppm hydroxytyrosol extract (HXT); 200 ppm acerola + 200 ppm pomegranate extract (P); 200 ppm acerola + 200 ppm rosemary extract (R). Different letters (a, b, c, d) in the same column indicate significant differences between samples (p < 0.05).

