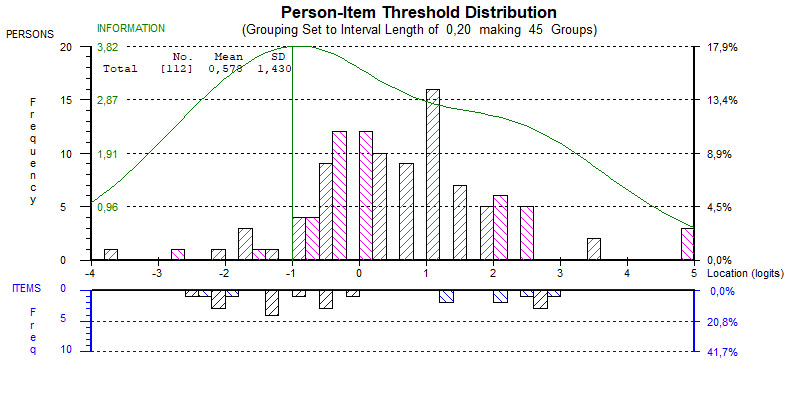
Figure 4.

Person-item threshold histograms for the 12-item version. Upper histogram (pink bars) shows person measurements reflecting lower leniency with the Health Integrator app to the left, and higher leniency with the Health Integrator app to the right, that is, the most lenient persons are to the right. The lower histogram (blue bars) shows item threshold estimates reflecting lower quality demands to the left and higher quality demands to the right. This implies that it was easier to agree to statements at the lower end corresponding to negative experiences of using the mobile health (mHealth) app compared with the less easy items to agree with at the upper end, corresponding to lifestyle consequences of using the mHealth app.
