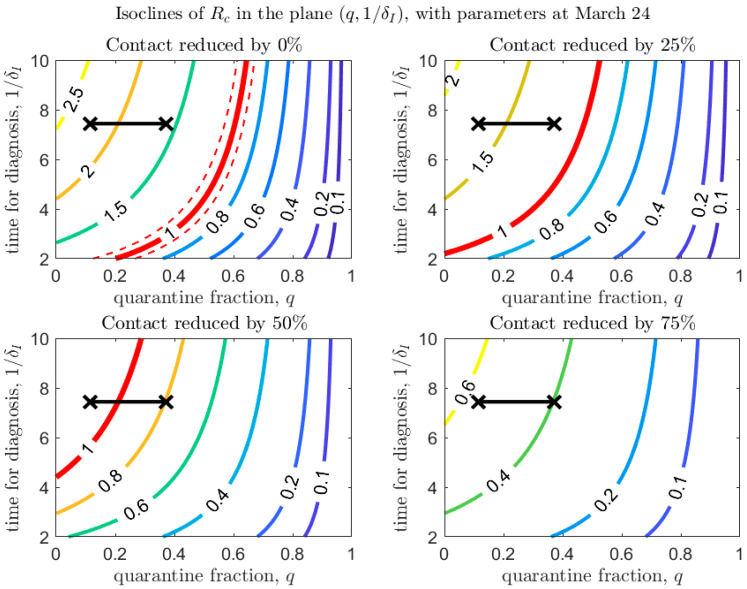
Figure 4.
Values of in the plane , with baseline parameters estimated on March 24 (top-left panel), and under different scenarios of contact rate reduction (other panels). The red line corresponds to (with dashed lines showing confidence intervals in the baseline scenario). The black crosses correspond to the parameters (max/min) estimated after March 24 (last day of the estimation period is April 21).

