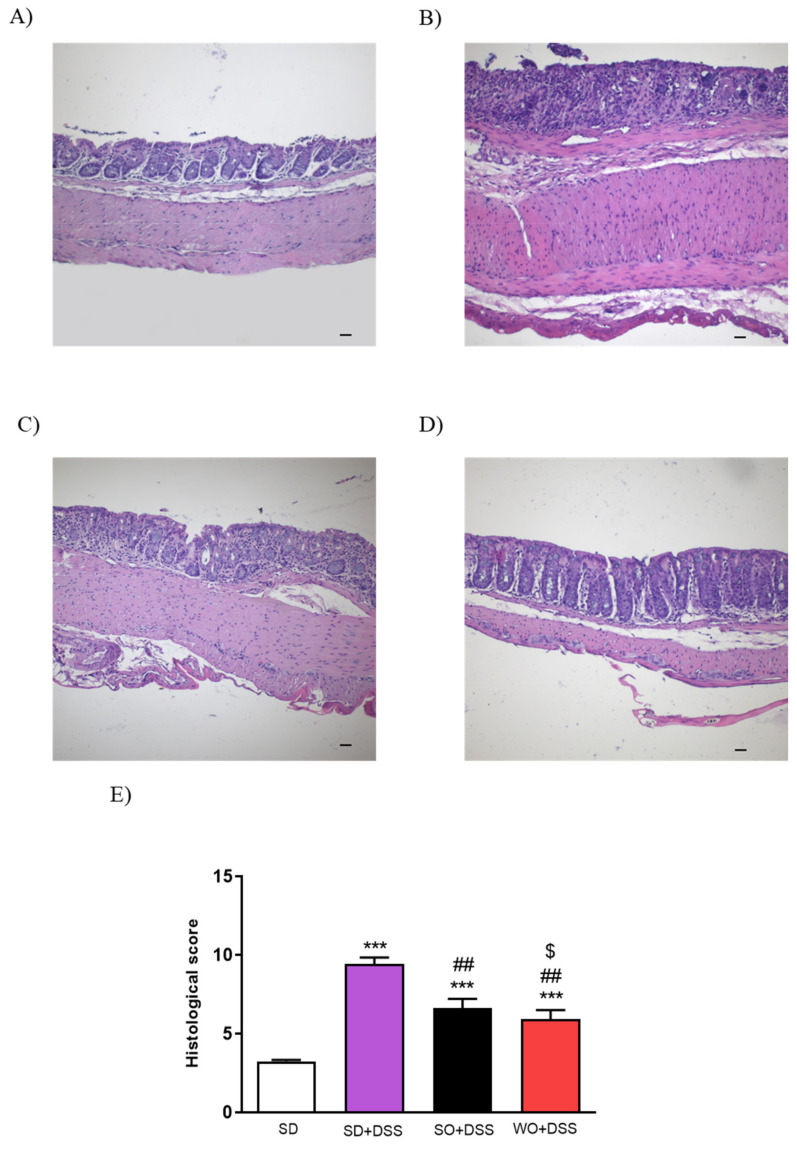
Figure 4.
Representative micrographs of hematoxylin and eosin-stained sections of distal colon from (A) SD, (B) SD + DSS, (C) SO + DSS, (D) WO + DSS, and microscopic total damage score (E). Scale bar = 100 μm. Data represent mean ± SEM, n = 8. *** p < 0.001, as compared to control; ## p < 0.01, ### p < 0.001 as compared to DSS; $ p < 0.05, as compared to sunflower oil (SO).

