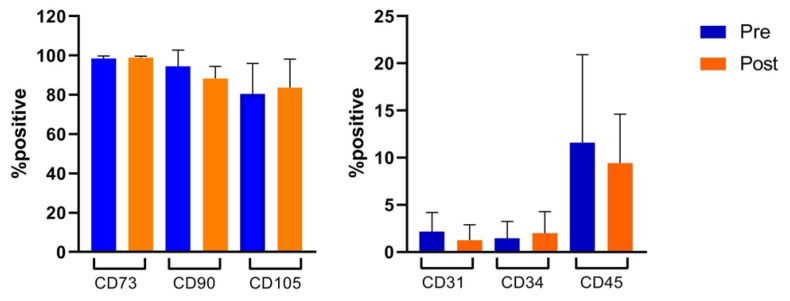
Figure 3.
Flow cytometry analysis. Immunophenotypic characterization was performed by flow cytometry on MSC (n = 13) and MSC-PTX (n = 12) after the first expansion phase (pre) and after expansion and loading in Quantum cell expansion system (post), respectively. The percentage of positive cells is reported as the mean ± SD. No statistically significant differences were found (p > 0.5).

