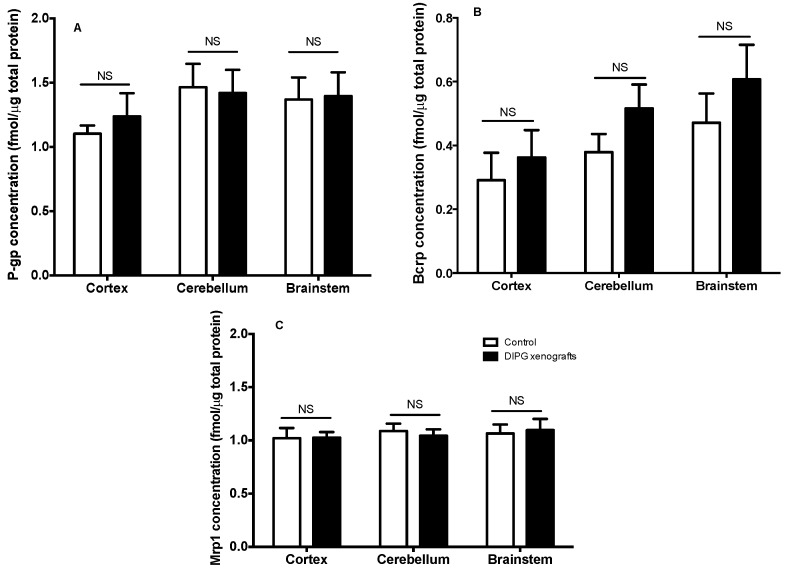
Figure 3.
P-glycoprtoein (P-gp) (A), Bcrp (B), and Mrp1 (C) expression levels in whole homogenates from the cortex, cerebellum, and brainstem of control sham vs. DIPG-bearing rats, measured by HPLC-MS/MS of 8-week-old RH-Foxn1rnu nude rats. Results are expressed as the mean absolute concentration (fmol μg−1) (n = 5 animals per group). Two-way ANOVA, no statistical difference between groups was observed (p > 0.05), regardless of the brain structure analyzed for any of the ATP-binding cassette (ABC) transporters measured (i.e. P-gp, Bcrp, Mrp1).

