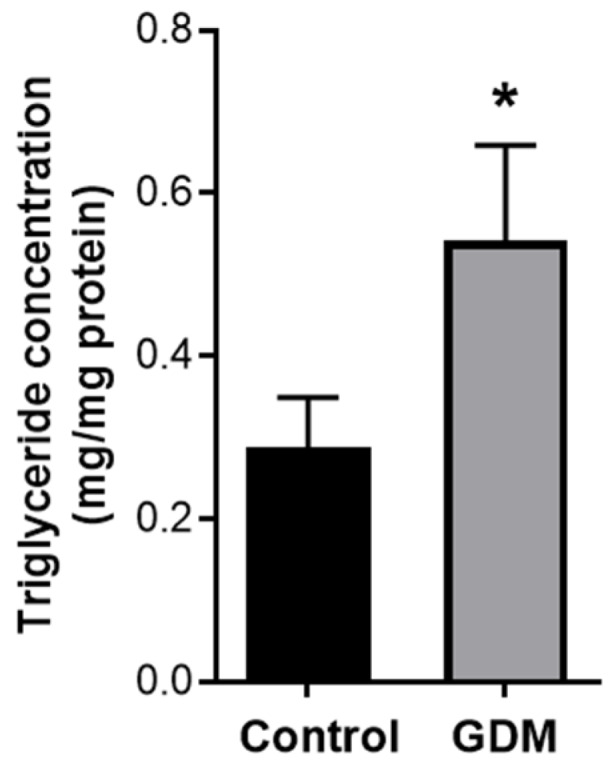
Figure 3.

Changes in triglyceride content in the trophoblasts exposed to control and GDM conditions. Primary human trophoblasts were cultured in standard conditions or with medium containing 25-mmol/L glucose and 10−7-mol/L insulin for 72 h. The intracellular triglyceride level in the cells was quantified with a colorimetric assay. Values are expressed as means ± SD of three independent experiments. * p < 0.05 vs. control.
