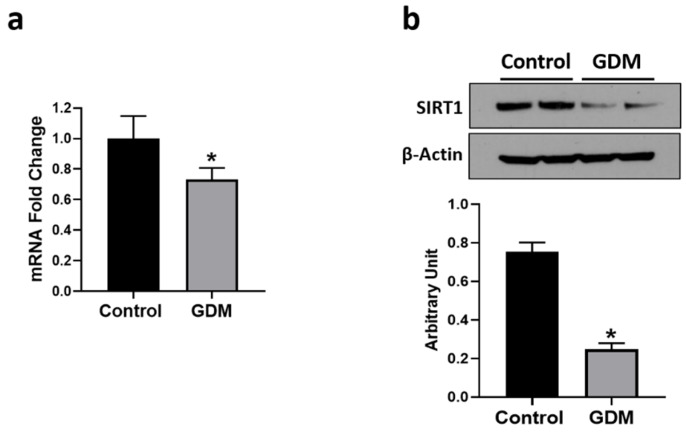
Figure 5.
Changes in mRNA and protein levels of SIRT1 in the trophoblasts exposed to control and GDM conditions. Primary human trophoblasts were cultured in standard conditions or with medium containing 25-mmol/L glucose and 10−7-mol/L insulin for 72 h. (a) Real-time PCR was used to measure SIRT1 mRNA levels. (b) Western blotting was used for the quantification of SIRT1 protein. Representative blots for SIRT1 is shown at the top; blot density obtained from densitometric scanning of SIRT1 normalized to β-actin is shown at the bottom. Values are given as means ± SD three independent experiments. * p < 0.05 vs. control.

