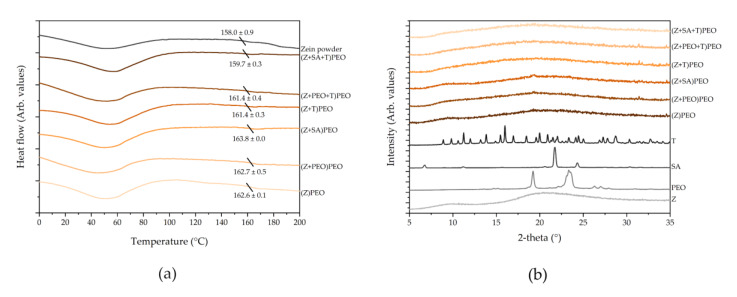
Figure 4.
Solid state analysis of zein fibers. (a) Differential scanning calorimetry (DSC) thermograms showing the total heat flow. The diagonal line represents a mean glass transition temperature (Tg), which is given with standard deviation. (b) X-ray diffraction (XRD) patterns of fibers after 4 months (orange colors) and the raw powder components of the fibers (grey colors). Key: PEO, polyethylene oxide; SA, stearic acid; T, tetracycline hydrochloride; Z, zein.

