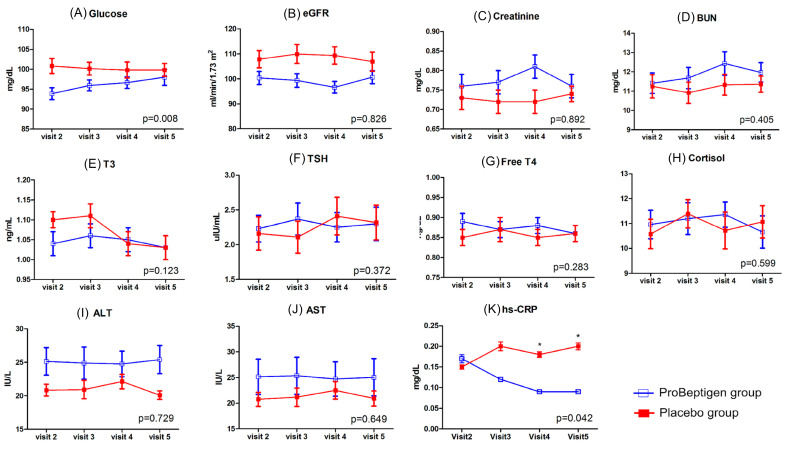
Figure 6.
Changes of biochemistry profiles. (A) Glucose, (B) Estimated glomerular filtration rate (eGFR), (C) Creatinine, (D) Blood urea nitrogen (BUN), (E) Triiodothyronine (T3), (F) Thyroid-stimulating hormone (TSH), (G) Free thyroxine (Free T4), (H) Cortisol, (I) Alanine transaminase (ALT), (J) Aspartate aminotransferase (AST), (K) High-sensitivity C-reactive protein (hs-CRP). Error bars represent standard errors. The p-value shown in each diagram denotes the statistics of time × treatment interaction after considering the baseline data as a covariate and the asterisk denotes a statistically significant between-group difference at the specific visit time.

