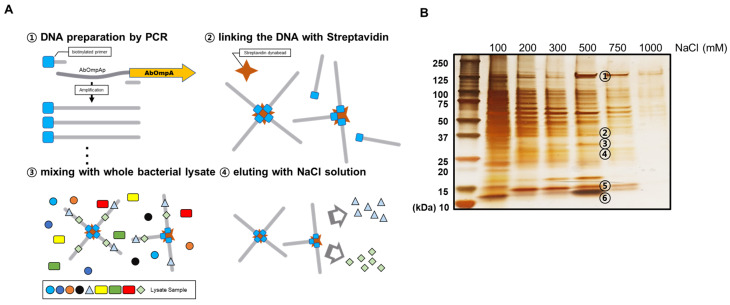
Figure 2.
Identification of proteins that bind to the AbOmpA promoter. The diagram depicts the overall scheme of the DNA affinity chromatography experiment (A). The proteins eluted from the DNA affinity chromatography were loaded onto 4–15% gradient SDS–PAGE and developed via silver staining (B). The bands with noticeable thickness in the 500 mM NaCl lane were chosen for identification via LC-MS/MS. The specific information of the identified proteins is listed in Supplementary Table S2.

