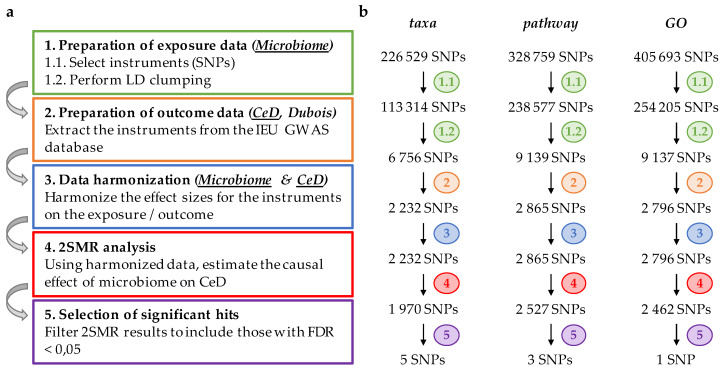
Figure 1.
Schematic representation of two-sample Mendelian randomization analysis (2SMR) using Bonder microbiome and Dubois celiac disease (CeD) genome-wide association study (GWAS) as exposure and outcome datasets, respectively. (a) Flowchart of the step-by-step analysis: after preparing exposure data (Step 1), outcome data is extracted (Step 2), both datasets are harmonized (Step 3), and 2SMR analysis is performed (Step 4); finally, significant hits are selected based on their false discovery rate (FDR) (Step 5); (b) Diagram, representing the number of single nucleotide polymorphisms (SNPs) selected in each category (taxa, pathway, gene ontology (GO)) after performing each step of the analysis.

