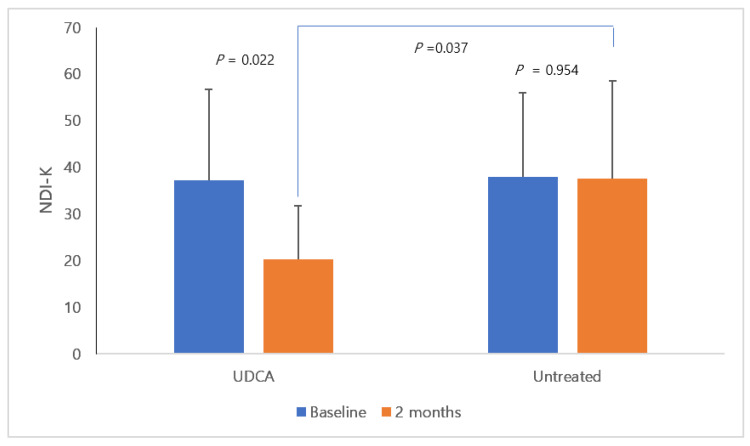
Figure 2.
NDI-K scores at baseline and at 2 months. In the group using UDCA, there was a statistically significant decrease in NDI-K score after 2 months (UDCA group: baseline vs. after 2 months; 37.2 ± 19.5 vs. 20.2 ± 11.6, p = 0.022; untreated group: 38.0 ± 18.0 vs. 37.6 ± 21.0, p = 0.950). In addition, there was a statistically significant difference in the NDI-K score between the UDCA-treated group and the untreated group at 2 months (p = 0.037). Bar graph shows the mean with the standard deviation.

