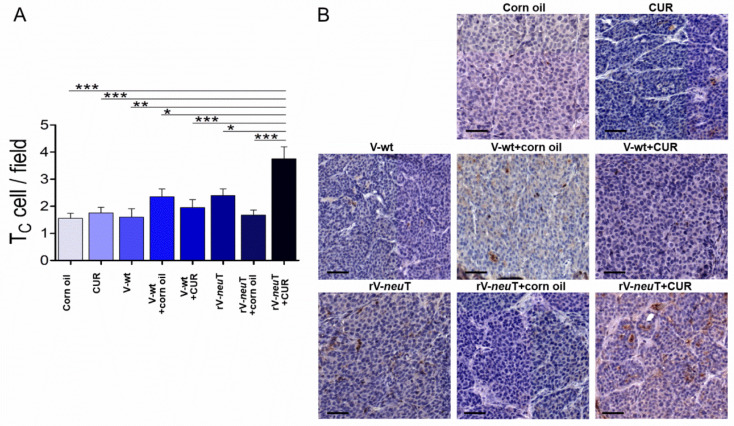
Figure 6.
Cytotoxic T cells infiltrating tumors in BALB-neuT mice after treatments. Tumor tissues from three mice in each group were analyzed with IHC for CD8 expression. (A) Positive cell count/field averaging 10 representative microscopic fields (mean ± SD, * p ≤ 0.05, ** p ≤ 0.01, *** p ≤ 0.001; one-way-ANOVA, Tukey’s multiple comparison). (B) Representative digital images (20×), scale bar represents 100 µm. TC: cytotoxic T lymphocytes, CUR: curcumin.

