Figure 3.
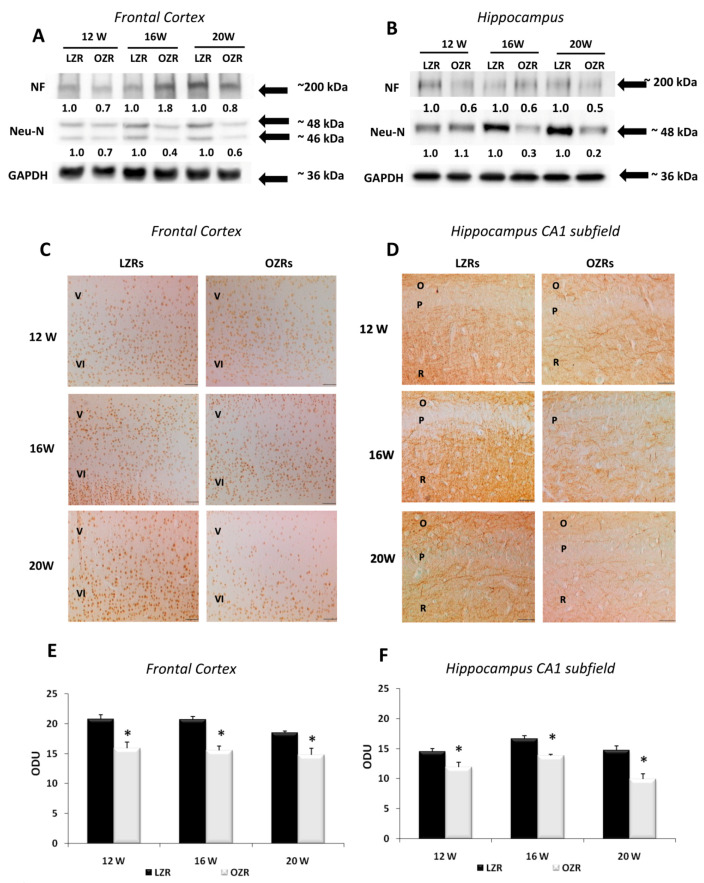
Neuronal markers. Immunochemical analysis of the frontal cortex (A) and hippocampus (B) processed with different antibodies anti-neurofilament (NF) and anti-neuronal nuclei protein (NeuN). To investigate more than NF and NeuN proteins on the same blot, both membranes of the frontal cortex and hippocampus were stripped and incubated with anti-GAPDH antibody (loading control). The densitometric analysis of bands is expressed as the ratio between the optical density of protein and reference protein (GADPH) where the value for LZRs of different ages is set as 1. Blots are representative of one of three separate experiments. (C) Sections of the frontal cortex of LZRs and OZRs of 12-, 16-, and 20-weeks age processed for the immunohistochemistry against Neu-N protein, to identified cell body neurons. V, VI: fifth and sixth layers of the frontal cortex. Magnification 20X. Calibration bar: 50 μm. (D) Sections of the hippocampus (CA1 subfield) of LZRs and OZRs of different weeks of age processed for the immunohistochemistry against axonal NF. O: stratum oriens; P: pyramidal neurons; R: stratum radiatum. Calibration bar: 50 μm. Densitometric analysis of the frontal cortex (E) and hippocampus (F) in sections processed for axonal NF immunohistochemistry. Data are expressed in optical density unit (ODU). These are mean + S.E.M. * p < 0.01 vs. age-matched LZRs.

