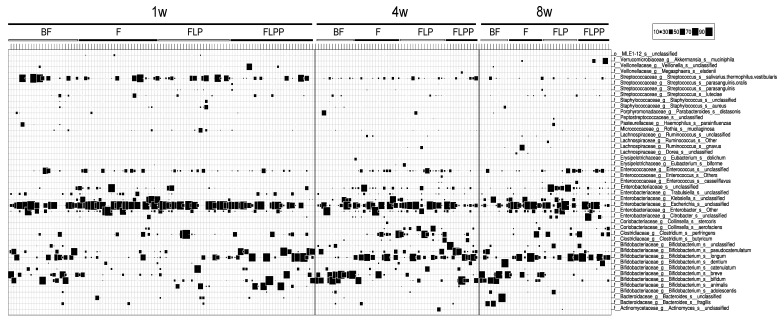
Figure 3.
Gut microbiota composition in infants from the four nutritional intervention groups (PP data set). Determination by 16S rRNA gene sequence analysis: bubble plot of bacteria determined at species level (identified at the right ordinate) for the intervention groups and time points specified on the top abscissa. The proportion of the specified bacterium in the specified sample is indicated by the size of the square (key at top right of the figure).

