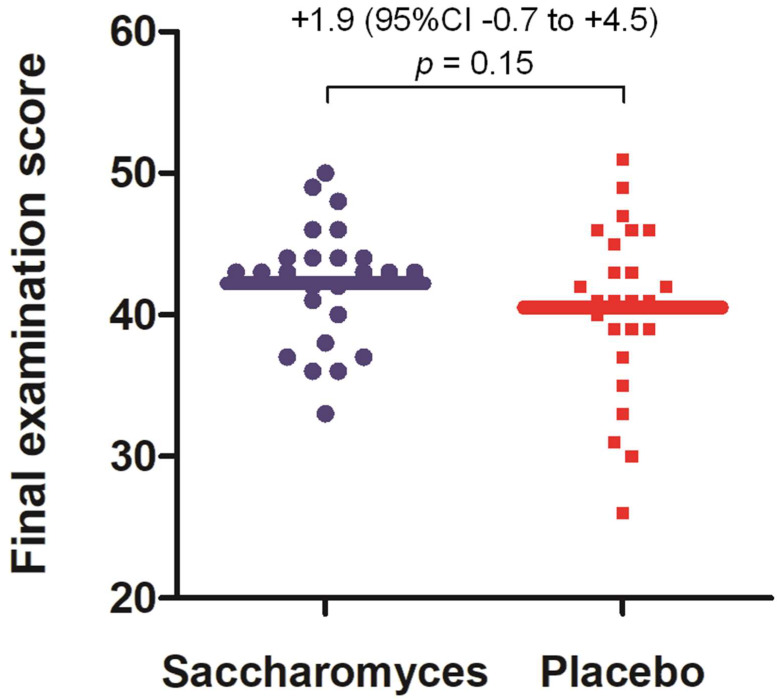
Figure 3.
Primary outcome measure: final examination scores. A per protocol analysis is presented. Individual data points are marked. The mean scores are represented by horizontal lines. The effect sizes of the difference in the scores together with a p-value for the comparison are reported above the graph. The analysis is presented after adjusting for the results of the preexamination test in pharmacology held a day before the final examination.

