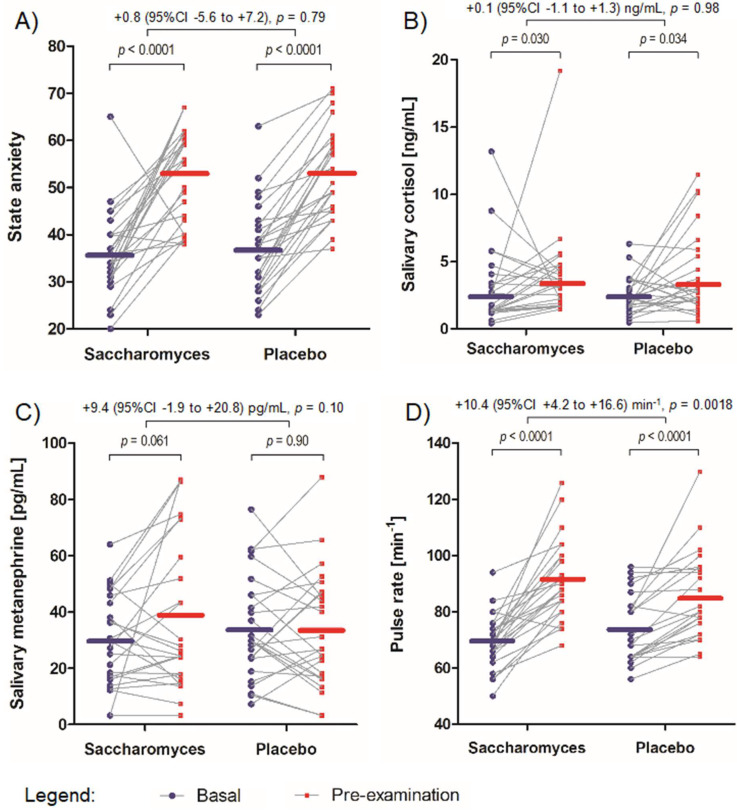
Figure 4.
Secondary outcome measures: Individual data points are marked and linked with a grey line between “basal” and “preexamination” time points. The mean scores are represented by horizontal lines for both “basal” and “preexamination” settings. The effect size of the differences between the increase in the measures together with p-values for the comparisons are reported above the graph. (A) The extent of increase in state anxiety between the study groups. (B) The extent of increase in salivary cortisol level between the study groups. (C) The extent of increase in salivary metanephrine level between the study groups. (D) The extent of increase in pulse rate between the study groups.

