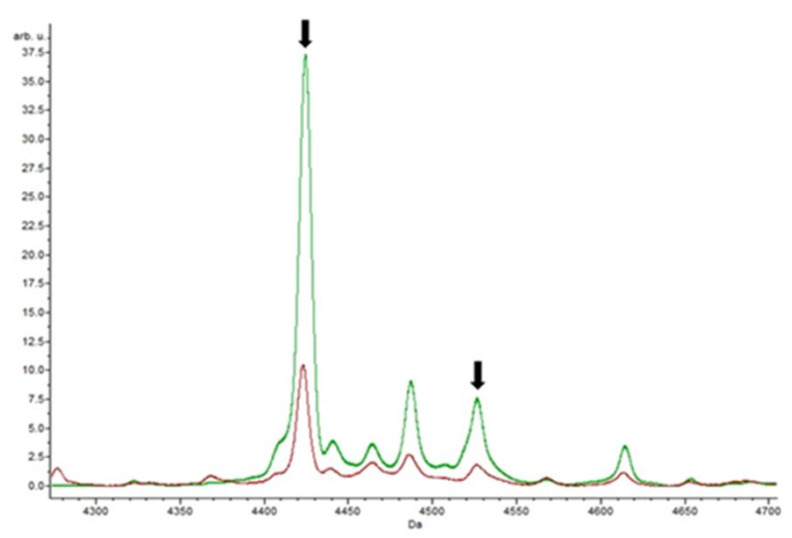
Figure 3.
Peaks obtained for tetracycline. From the analysis of the ClinProTools software, the control spectrum without antibiotics (red) and the spectrum with the action of tetracycline (green) were obtained. The results show statistically significant peaks, with a p-value of 0.0000001, such as masses m/z 4424.01 and m/z 4526.45 noted by arrows.

