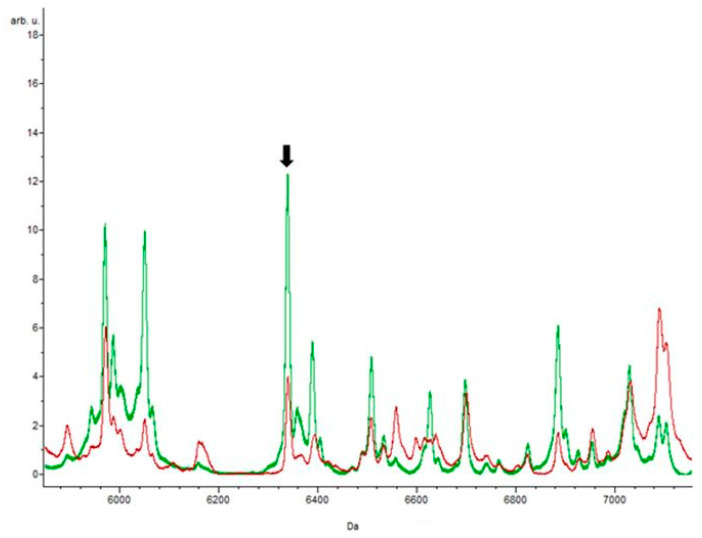
Figure 5.
The red spectrum represents the control, and the green spectrum was obtained by the action of ciprofloxacin. The arrow shows the peak at m/z 4652.66 with greater intensity in the presence of the antibiotic. Among the 27 specific peaks detected in the isolates resistant to ampicillin, only the peak with mass m/z 6338 was identified by the three classification algorithms, with an area under the curve (AUC) value of 0.89. This peak was also identified in erythromycin-resistant isolates. In contrast, three other peaks, m/z 2361.38, m/z 3304.92, and m/z 7240.29, proved to be exclusive to these isolates, which means they are potential biomarkers of ampicillin resistance.

