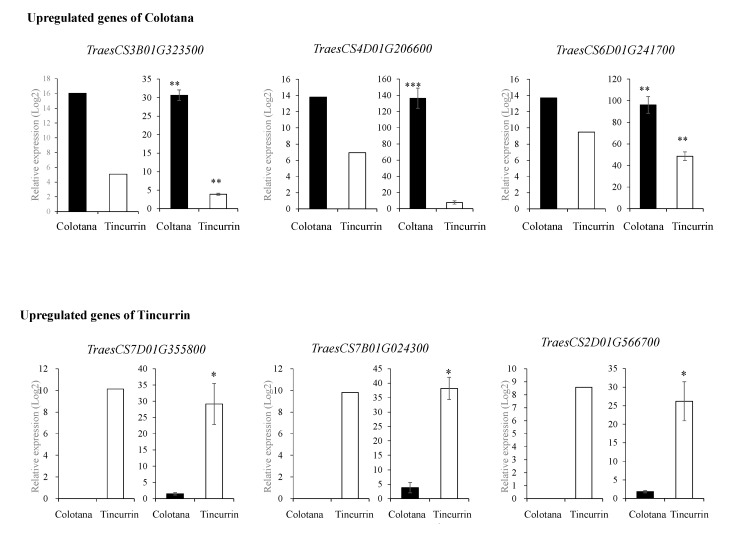
Figure 2.
qRT-PCR validation of up- and downregulated DEGs in Colotana and Tincurrin. RNA-seq results (left) and qRT-PCR results (right) for six genes. Values are means ± SD of three biological replicates in qRT-PCR. The expression levels of each gene are expressed as relative to the mean value of the control samples. Student’s t-test was used to assess the significance of differences from control samples, * p < 0.05, ** p < 0.01, *** p < 0.001.

