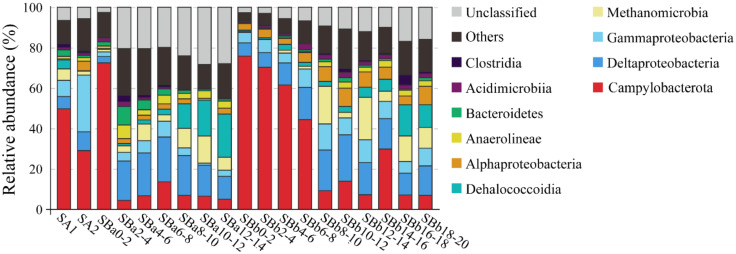
Figure 4.
The diversity and distribution of microbial sequence tags in the libraries of sediment samples. SA1 and SA2 represent the libraries of the sediments covered with the animal community; SBa and SBb represent the libraries of the sediments away from the center, with the numbers after SBa and SBb indicating the depth (cm). The sequence tags were generated with the next-generation sequencing (NGS) platform and classified at the phylum/class level. Each color represents the percentage of the taxon in the total assemblage. The top 10 groups in each sample are labeled, and other groups are integrated as “Others”.

