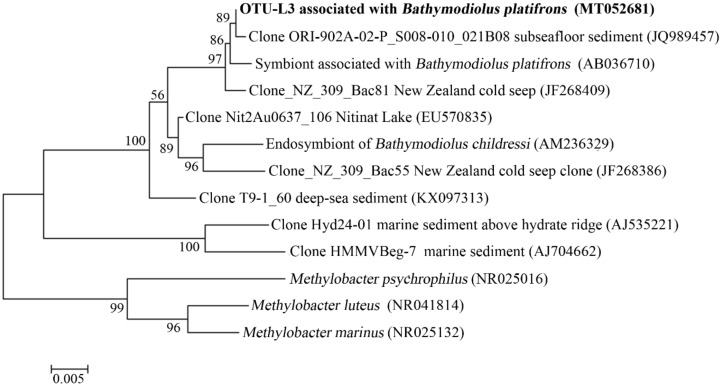
Figure 8.
The maximum-likelihood phylogenetic tree based on 16S rRNA gene sequences showing the position of OTU-L3 from this study. Close sequences from NCBI database were selected to construct the tree. GenBank accession numbers are shown in parenthesis. Only bootstrap values (expressed as percentages of 1000 replications) equal or greater than 50% are shown at branching points. Scale bar, 0.005 substitutions per nucleotide position.

