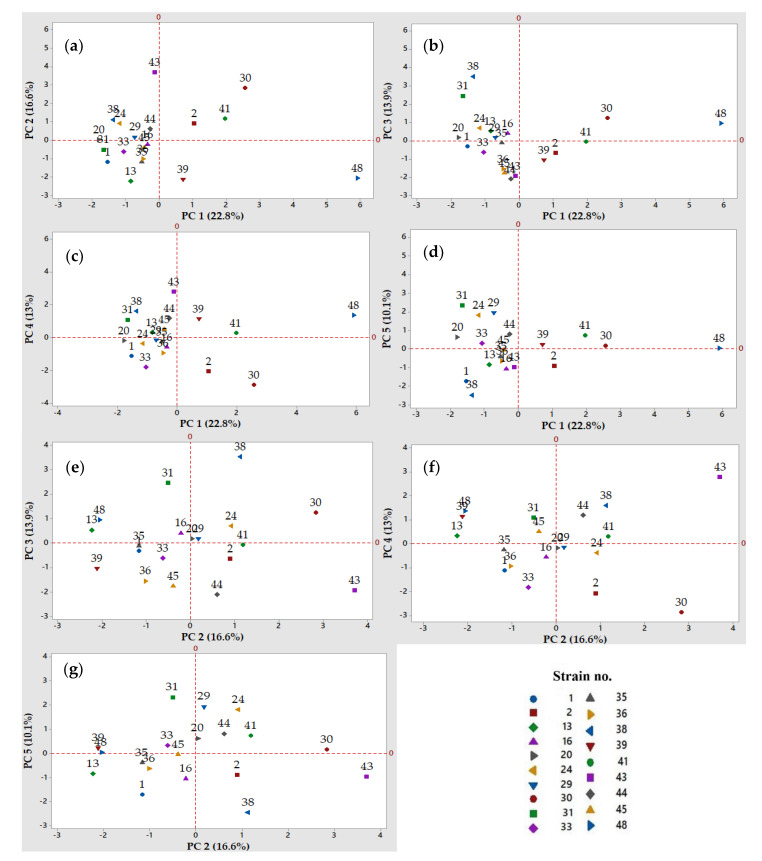
Figure 3.
Two-dimensional score plots of the Principal Component Analysis (PCA). Projection of the observations (LAB strains) into the principal component (PC) 1 to 5 (cumulative percent variability in parentheses), for the independent variables depicted in Figure 2: (a) PC 1 and PC 2 (39.4%); (b) PC 1 and PC 3 (36.7%); (c) PC 1 and PC 4 (35.8%); (d) PC 1 and PC 5 (32.9%); (e) PC 2 and PC 3 (30.5%); (f) PC 2 and PC 4 (29.4%); and (g) PC 2 and PC 5 (26.7%). The numbers in the plots refer to the identification of LAB strains.

