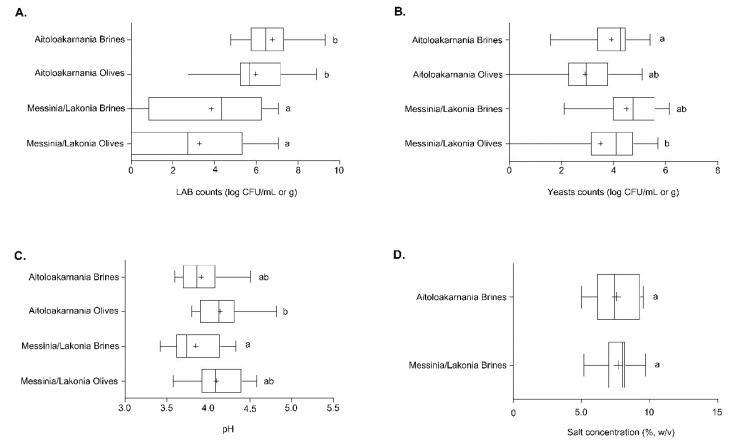
Figure 2.
Boxplots of lactic acid bacteria (LAB) (A) and yeast (B) counts as well as pH values (C) from the olives and brines, along with salt concentration (D) from the brines of natural black cv. Kalamata olives from the two geographical regions. Different letters indicate statistically significant differences (p < 0.05).

