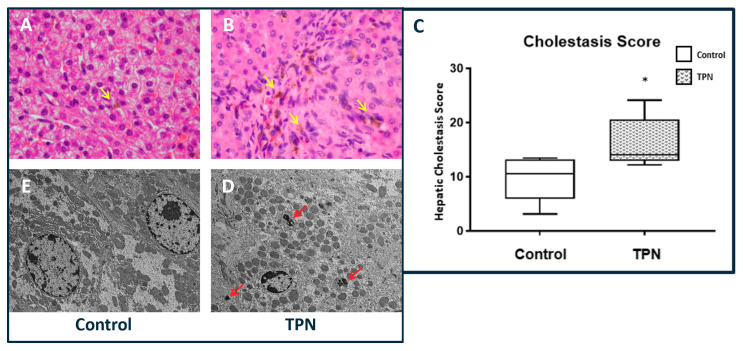
Figure 2.
Hepatic cholestasis. (A,B) Hematoxylin and eosin (H&E) stain, 40× magnification showing increased cholestasis in TPN animals (yellow arrows). (C) Cholestasis score was significantly higher with TPN. The figure shows box and whisker plots in which boxes represent the 25–75th percentile, and center lines represent median values. A pairwise Mann–Whitney U test was conducted to determine p-value. All tests were two-sided, using a significance level of 0.05. (D,E) Electron microscopy at 5000× magnification showing bile deposits (red arrows) in TPN-treated animals but not in controls.

