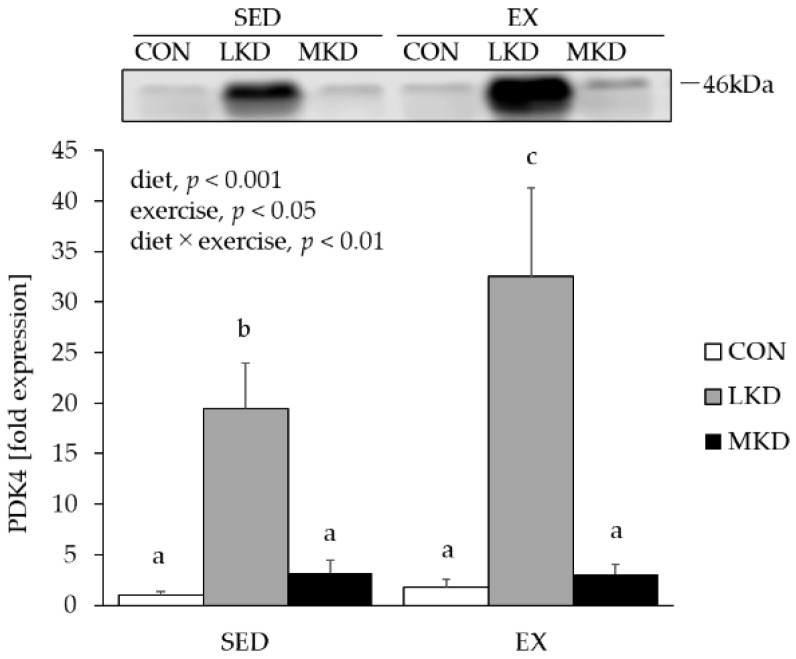
Figure 5.
Protein expression of PDK4 in epitrochlearis muscle tissue. Two-way ANOVA was performed, followed by a Tukey–Kramer multiple-comparison test. Means of treatments labeled with the same letter are not significantly different from each other. Values are means ± SEM, n = 7. A representative western immunoblot image is shown.

