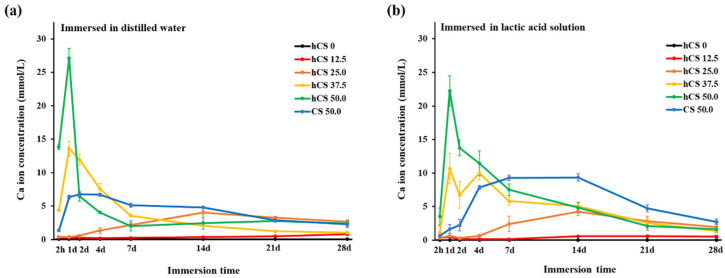
Figure 5.
Concentration of Ca ion released into a refreshed solution at each measurement time point from 2 h to 28 d in distilled water (a) and lactic acid solution (b). Each value represents the average of 5 repeated measurement, and the error bars indicate the standard deviation of the average values (average ± standard deviation; n = 5).

