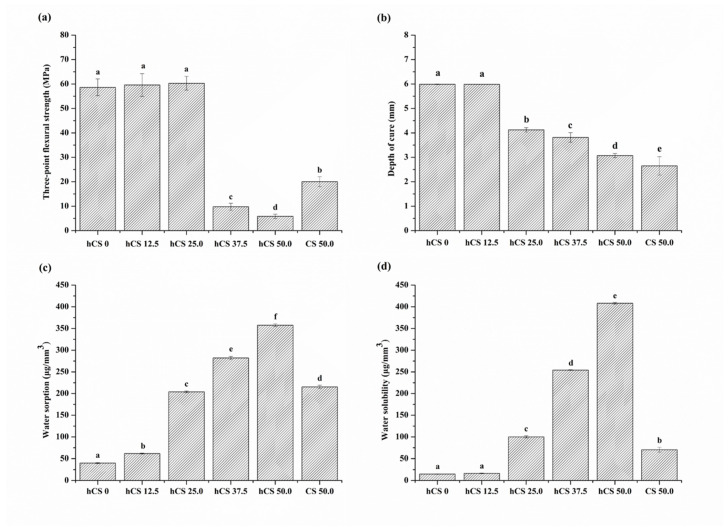
Figure 6.
Results of the flexural strength (a), depth of cure (b), water sorption (c), and solubility (d) of each group. Each value represents the mean of 6 measurements, and the error bars represent the standard deviation of the mean (average ± standard deviation; n = 6). For each of the mechanical and physical properties, the same lowercase letter indicates no differences among the experimental groups (p > 0.05).

