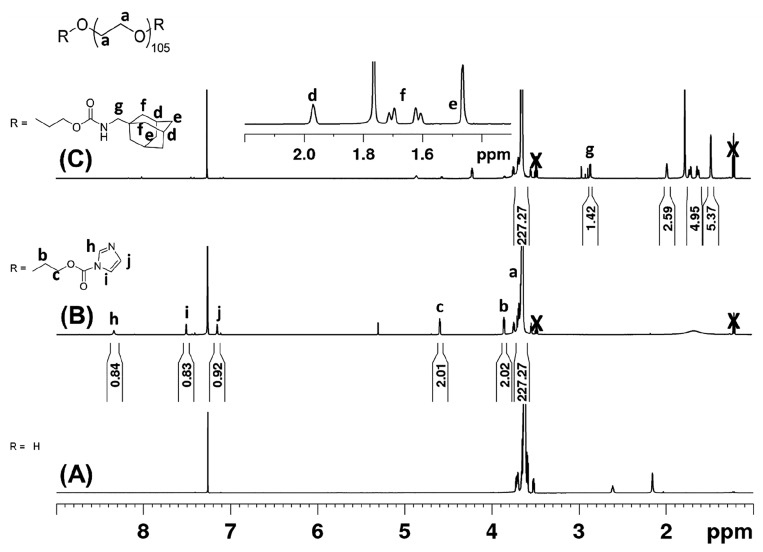
Figure 3.
1H NMR spectrum (CDCl3) of (A) PEG2, (B) PEG2-CDI, and (C) PEG2-ADA. The appearance of CDI specific peaks (h, i, and j) and α and β methylene protons (c, b) were observed after reaction of PEG2 with CDI. Following reaction of PEG2-CDI with adamantane methylamine, appearance of adamantane specific peaks (d, e, f, and g) and disappearance of CDI peaks were observed. X denotes presence of residual diethyl ether.

