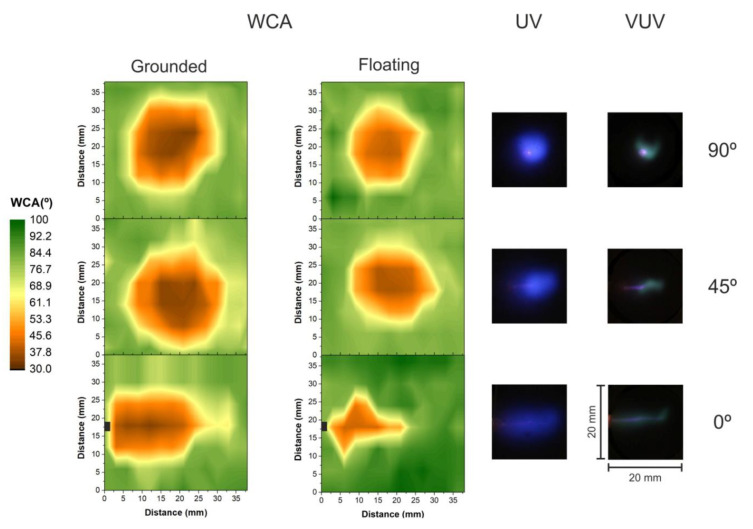
Figure 6.
WCA color maps of treated PET for 60 s and three different plasma plume tilting angles, 90°, 45° and 0°, in grounded (left column) and floating (right column) condition. The plasma plume was directed to the right-hand side of the contour maps and the tube tip position is marked in black for the 0° cases. UV (blue) and VUV (green) emission profiles are also displayed for each condition in the same scale as the WCA maps.

