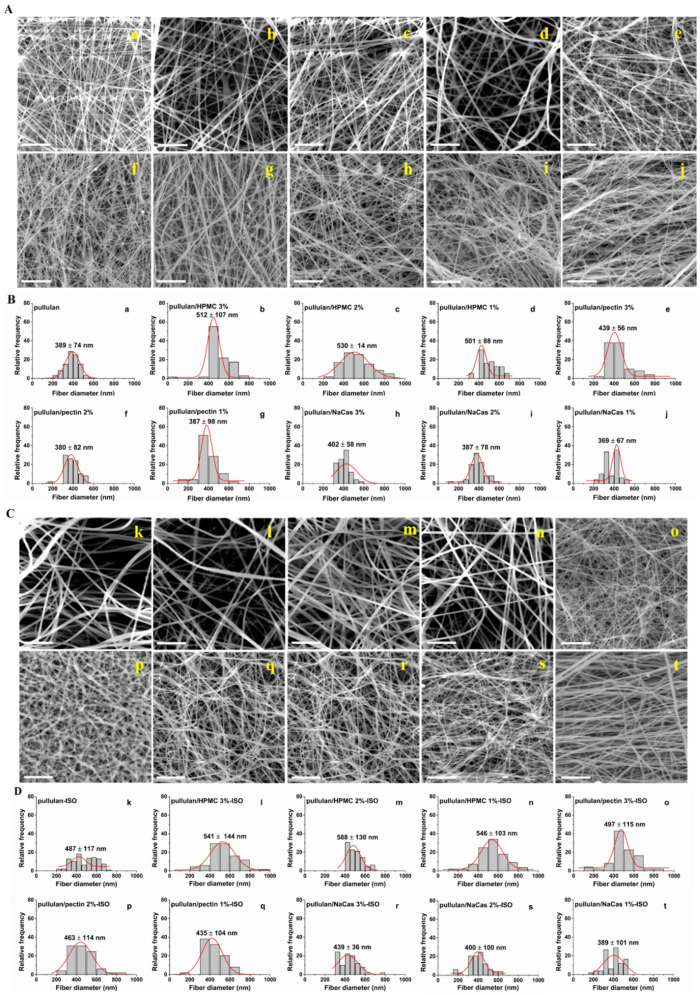
Figure 2.
(A) and (C) SEM images of the ODF formulations containing (a) pullulan, (b) pullulan/HPMC 3%, (c) pullulan/HPMC 2%, (d) pullulan/HPMC 1%, (e) pullulan/pectin 3%, (f) pullulan/pectin 2%, (g) pullulan/pectin 1%, (h) pullulan/NaCas 3%, (i) pullulan/NaCas 2%, (j) pullulan/NaCas 1% and (k) pullulan-ISO, (l) pullulan/HPMC 3%-ISO, (m) pullulan/HPMC 2%-ISO, (n) pullulan/HPMC 1%-ISO, (o) pullulan/pectin 3%-ISO, (p) pullulan/pectin 2%-ISO, (q) pullulan/pectin 1%-ISO, (r) pullulan/NaCas 3%-ISO, (s) pullulan/NaCas 2%-ISO and (t) pullulan/NaCas 1%-ISO and their respective diameter distributions (B). (a–j) and (D). (k–t). Scale bar: 10 μm.

