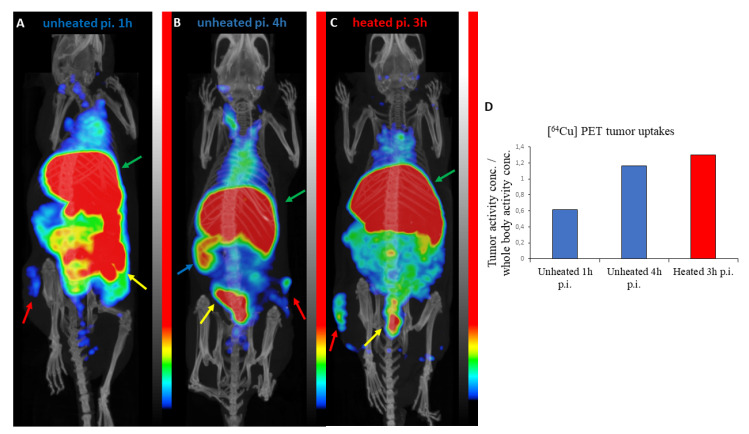
Figure 5.
Positron emission tomography/CT (PET/CT) imaging results. Maximum intensity projections of PET/CT images showing the biodistribution of [64Cu]Cu-neocuproine liposomes (HEAT SENS LIPO) in control (A,B) and mild hyperthermia treated (C) mice. The liver (green arrows) and intestine (yellow arrows) of all animals show high activities. The tumor (red arrows) also shows increased uptake and is easily distinguishable from its surroundings on all images. The spleen (blue arrow) of a control animal shows high uptake 4 h p.i. (B). There is a marked difference between the tumor activity concentrations (normalized to whole body concentrations) between the 1 h p.i. and 4 h p.i. control animals (D).

