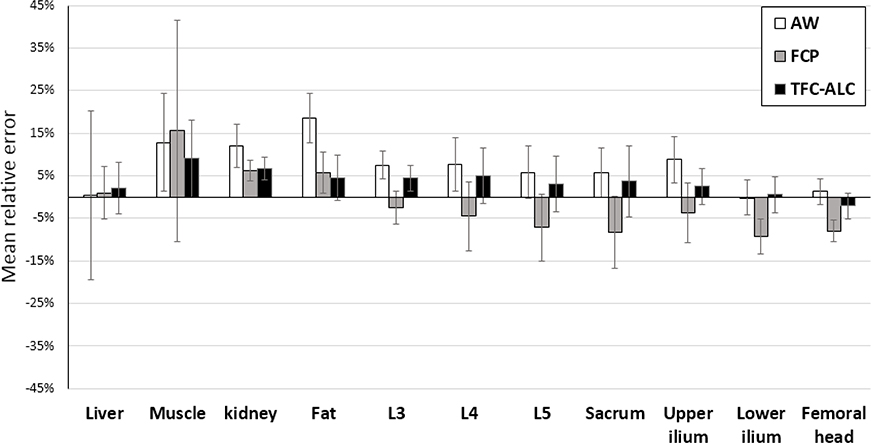
Fig. 8.
Means and standard deviations of SUV errors of three methods are depicted as the column heights and error bars, respectively, for different tissue types in abdomen and pelvis. They are calculated from the 20 runs of each method for each of the 10 subjects (see Section VI.) The reference standard is taken from the images reconstructed using the measured CT after deformable registration (Section V).

