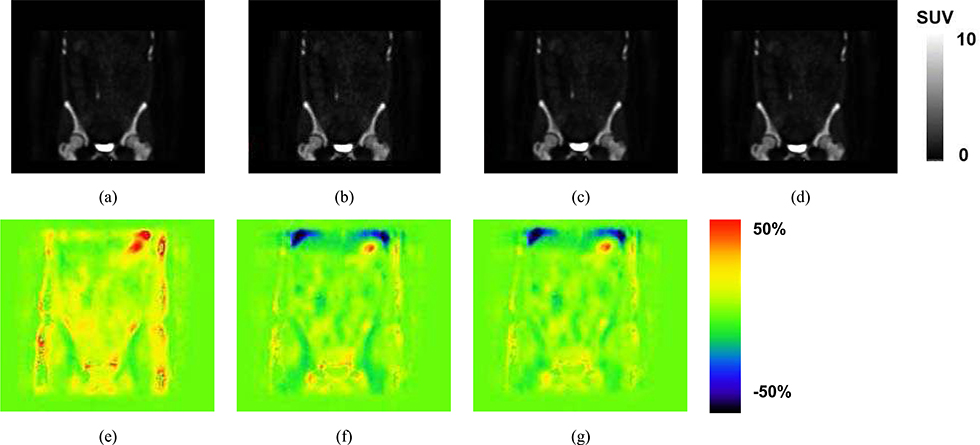
Fig. 9.
Example NaF-PET SUV images reconstructed using attenuation correction based on (a) CT, (b) All Water, AW, (c) Four Cluster Prototype, FCP, (d) our proposed method TFC-ALC. The subject and location correspond to those of Fig. 7. The SUV scale has been set to 10 as a balance between allowing the low concentration features to be visualized without excessive saturation in bone and bladder. Differences between the images are difficult to visualize so we present corresponding difference images. %SUV error maps are computed as the SUV result using (e) All Water, AW, (f) Four Cluster Prototype, FCP, or (g) our proposed method TFC-ALC, each minus the SUV image determined using the CT-based AC which serves as the reference. A threshold of 0.1 was applied to avoid exacerbation of errors in tissues having low uptake. The color bar spans plus or minus 50% error. Negative errors, tending toward blue, correspond to where the method has an SUV that is lower than the reference whereas positive errors, tending toward red, correspond to where the method has an SUV that is higher than the reference. The blue area towards the top of the image is at the interface of the lung and liver.

