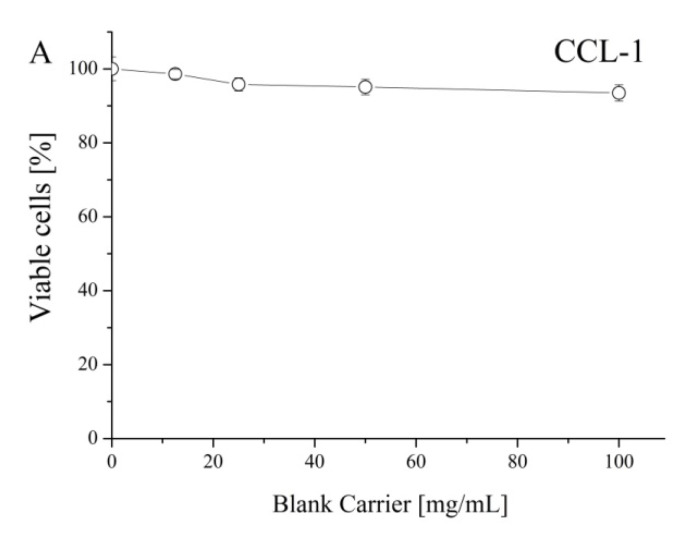
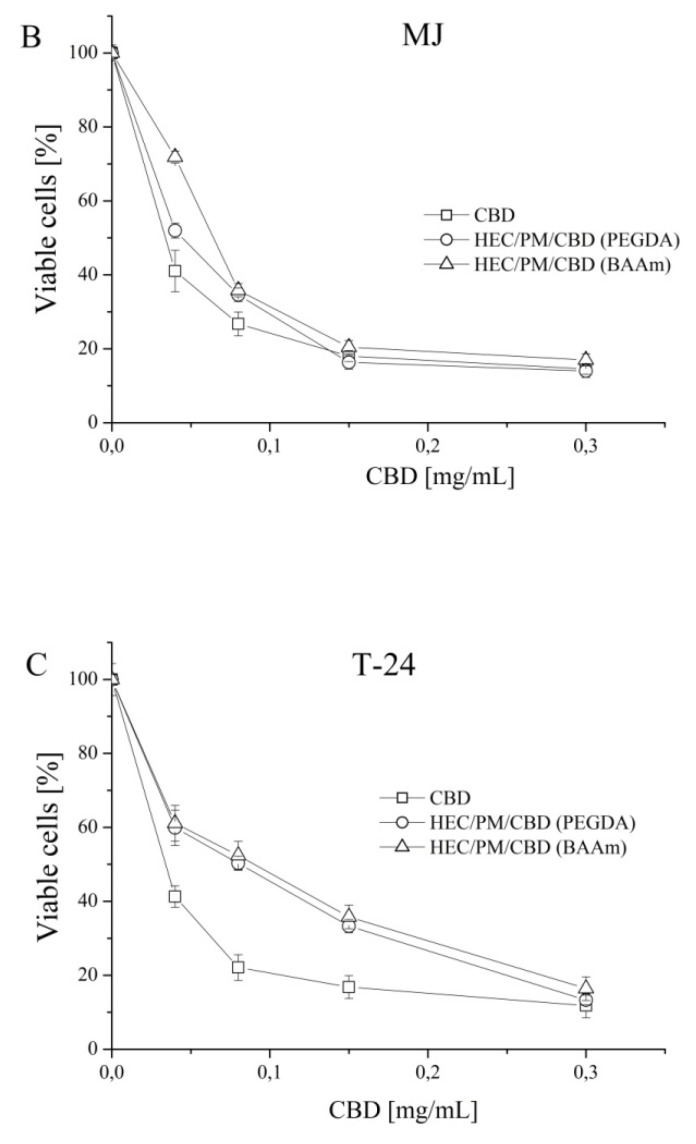
Figure 7.
Concentration-response curves determined by the MTT-dye reduction assay after 72 h of continuous exposure for mouse fibroblast cells (CCL-1) and human tumor T-cell lymphocyte (MJ) and urinary bladder carcinoma (T-24) cell lines. Each data point represents an average arithmetic value ± standard deviation of at least 12 independent experiments.


